Alerting
Dashboard interface
If your operations include events occurring on video stream that you need to detect and analyse, you will probably set up an alerting dashboard.

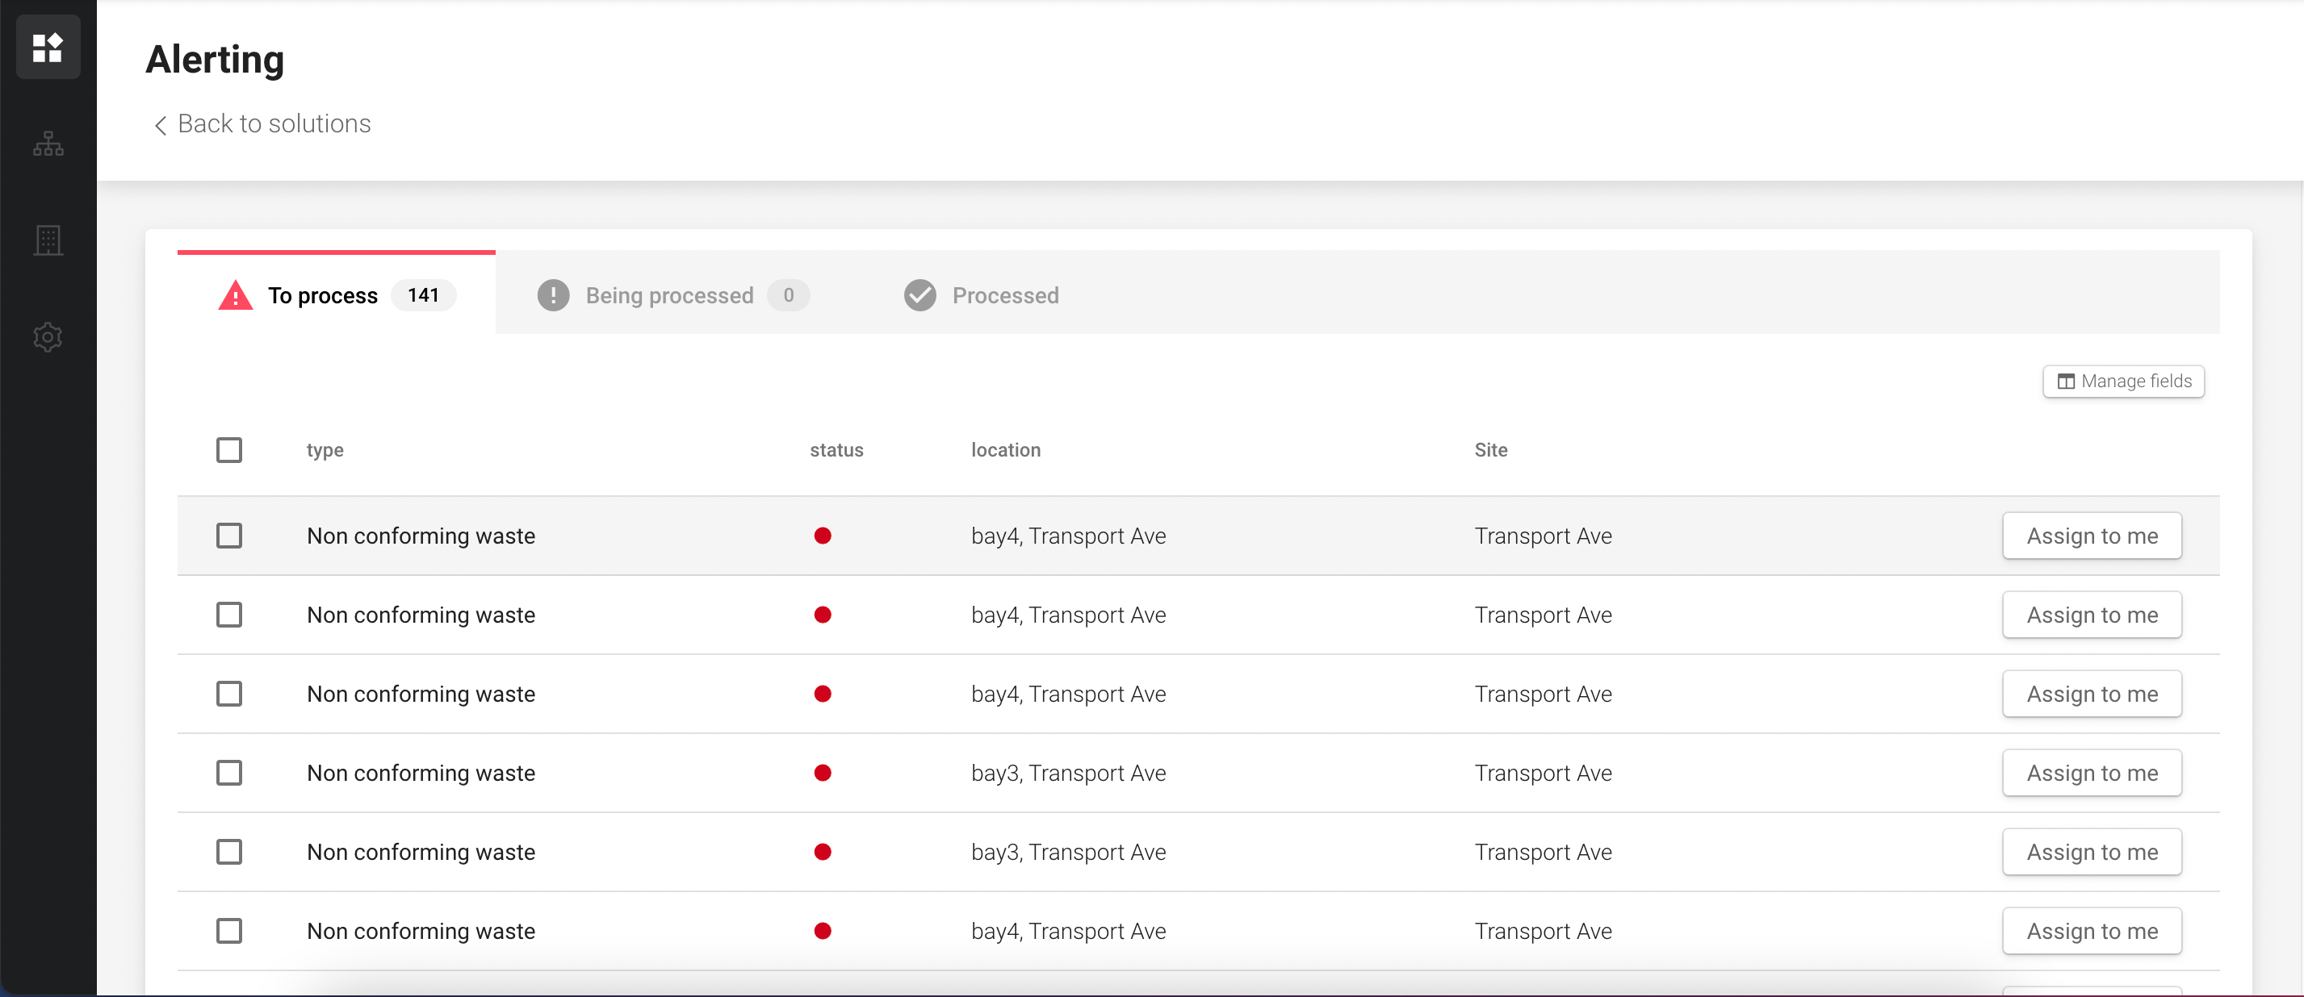
As can be seen above, the main dashboard view lists your events in three separate tabs: "To process", "Being processed" and "Processed".
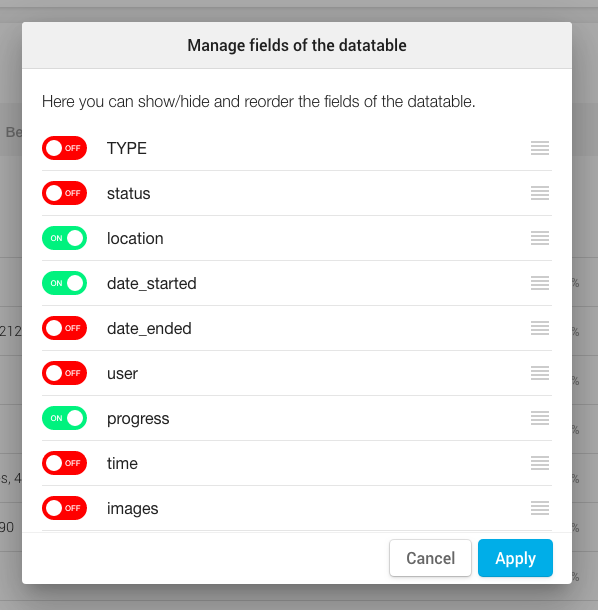
The columns of this view are customizable. You can click on "Manage fields" at any time to select the fields you wish to display and order them in the most optimal way. It is also possible to add fields via your application settings.

Event interface
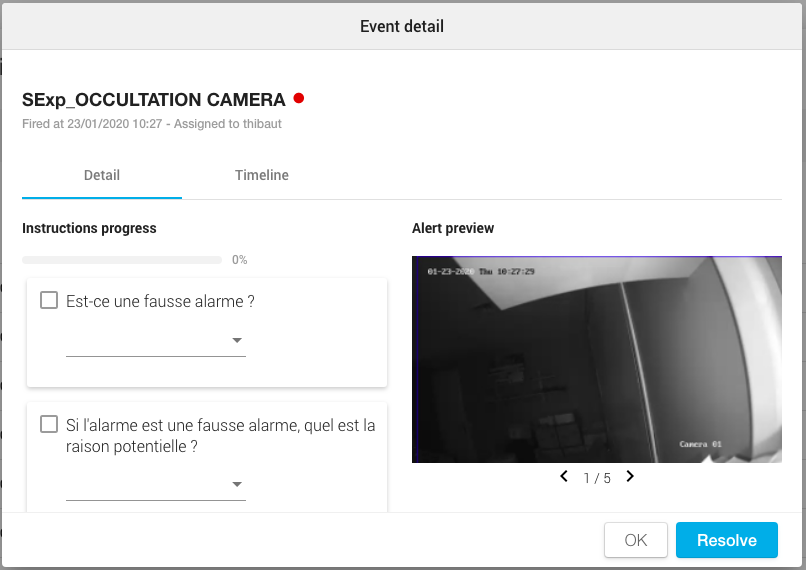
When accessing an event view on this dashboard (either by clicking on it or by self-assigning the event), the user will get a view similar to the one below.

For the event in question, we can see different elements:
a first tab "Detail" with a list of instructions. Those instructions are defined in your application and custom to your business need. They can be mandatory or not, and they can require that you tick a box, select a value or input some text.
on the same "Detail" tab, you get a preview of the alert with images helping you to understand the event in its context.
a second tab "Timeline" on which we log all the changes related to this event (completion of instructions, change of assignment etc.)
Last updated
Was this helpful?