
February 10, 2022
NEW FEATURES 🚀
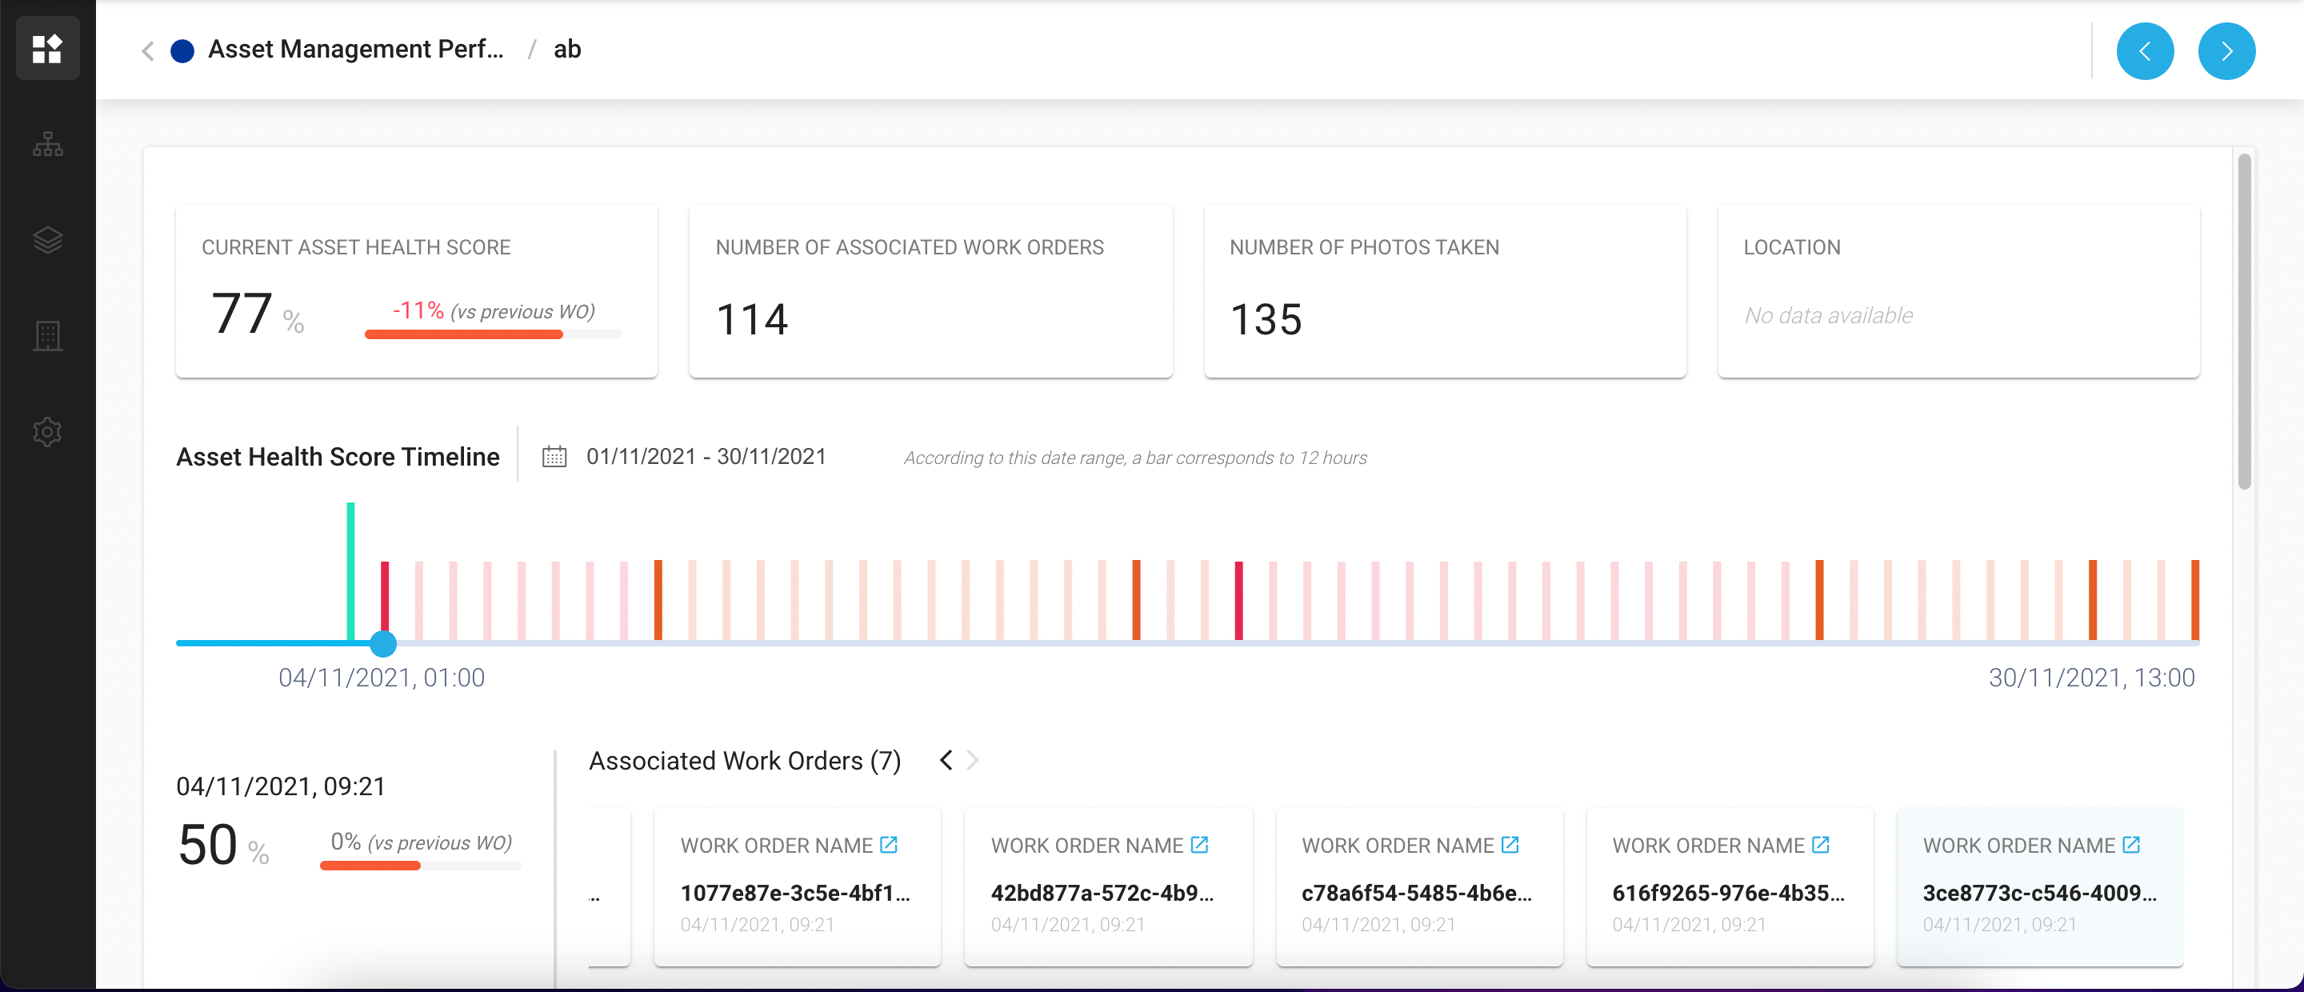
New visualization for asset performance 
Improved experience when creating an application 
More options for managing task groups
IMPROVEMENTS 👍
FIXES 🔧

Last updated
Was this helpful?